We get to know which ones sit behind shoddy Internet connections as there are a number of POP3 Connector errors on a regular basis.
We can see security warnings, audit warnings and the like.
However, there are a couple of key ways we can further get to know our SBS boxes and their peculiarities.
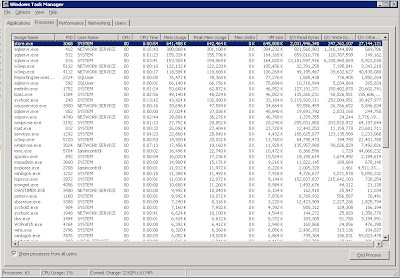
One is to setup the Task Manager so that we can get a more thorough look at what is happening on the SBS box at a glance:

Keeping an eye on things as they are happening is a good way to get a deeper feel for how the various components of the server operate.
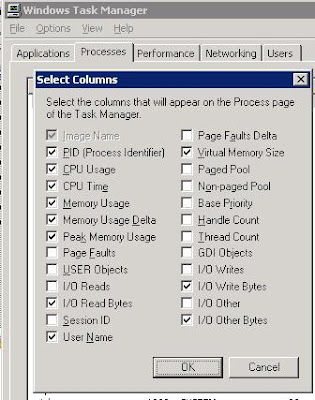
To do this:
- Open Task Manager
- Click View
- Select Columns
Click the following (I forget which ones are there by default so excuse any duplication): - PID
- CPU Usage
- CPU Time
- Memory Usage
Memory Usage Delta - Peak Memory Usage
- I/O Read bytes
- User Name
Virtual Memory Size - I/O Write Bytes
- I/O Other bytes
- Click OK

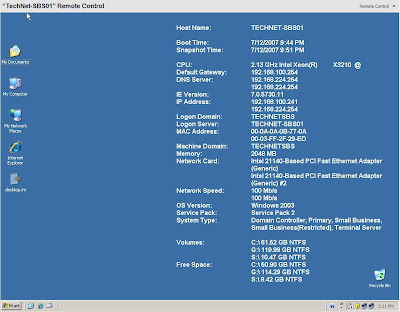
Another "at a glance" tool is BGInfo by SysInternals.
Here is a shot of our TechNet Plus software SBS Premium based testbed/lab with the utility's image as a desktop background:

The above is one of the first things seen when logging on to the SBS box before the Server Management Console comes up.
An .ini file for BGInfo can be stored somewhere on the network and used to provide all of the servers on the network with the same settings. This provides a convenient way for us to see the same info on all of the servers.
SysInternal's Utilities Index.
Philip Elder
MPECS Inc.
Microsoft Small Business Specialists
*All Mac on SBS posts are posted on our in-house iMac via the Safari Web browser.
No comments:
Post a Comment